Enabling objective, accurate, and efficient methods for differentiating between life threatening and non-life threatening conditions in the ER.
VertigoMetrics Diagnostic (Verto)
The background.
Dizziness is one of the most common complaints in ER. The causes of dizziness can be life threatening, such as a stroke, or non-life threatening, such as vestibular neuritis. In either case, the primary goal of ER physicians is to rule out life threatening causes as quickly and with as much confidence as possible. Currently, when a patient comes into the ER with dizziness they must go through extensive, primarily qualitative exams and/or expensive testing to determine the cause of dizziness.
Over the course of a 10-week series of design sprints, a team of Northwestern EDI students paired up with a start-up, VertigoMetric Diagnostic, to help design a digital interface for their novel retinal diagnostic technology for use in emergency rooms. Our goal was to design a digital interface and workflow that would enable an objective, accurate, and efficient method for differentiating between life threatening and non-life threatening conditions to save time and resources while guiding subsequent actions in the ER.
The team.
MS Engineering Design Innovation: Katrina Shah, Erica Isaacs, Hua Chin, Sally Park, Sheila Lo
VertigoMetric Diagnostic Start-up: Smit Naik, Amir Vahabikashi, Dr. Marcello Cherchi (Neurologist)
Advisors: Haoqi Zhang, Billy Banks, Amish Desai
My Role: Design/field research, journey mapping, storyboarding, UI & UX design, animation & final video production.
Primary User Groups
Technician
Responsibilities
Trained to run a specific machine such as OCT camera
Responsible for setting up patient in device, capturing pictures of each eye, doing initial image processing and sending information to physician for additional processing and evaluation
Needs/Goals
Goal is to produce a high quality image
Need to understand eye anatomy and make adjustments to image analysis
Needs to quickly and accurately communicate the results of examination to other stakeholders
Physician (e.g, Neurologist)
Responsibilities
Investigates for cause of chief complaint
Calls for tests and labs to be done
Interprets results of tests and labs
Needs/Goals
Needs to decide if patient is presenting a life threatening illness
Needs to be confident in the quality of image sent by technician
Needs to be confident technicians/softwares image analysis
Goal is to feel confident in diagnosis/next steps
Patient
Characteristics
Presented to the ER with acute dizziness
No obvious signs of stroke (passes FAST)
Needs/Goals
Needs appropriate care for their symptoms
Wants to feel confident in ER care
Wants to feel comfortable
Wants to not feel more stressed than necessary
Wants to be informed
User Research
“Biggest challenge: hesitancy of pulling the gun too quickly when patient was fine and getting wrong information from ER”
— Charge nurse
“My work is like an “art”, where you can only know through physical interactions and examinations, where even then the diagnosis is left to the interpretation and experience of the neurologist”
— Neurologist Resident
“Most stressful part is uncertainty. 50% of cases you don’t figure out cause of dizziness”
— Medical Student, ER
The process (at a glance).
Field Research
Understanding the use-context (e.g., users, environments, workflows) and current technologies was the foundation to discovering existing mental models and behavioral patterns, that would inform and shape our UX & UI. To do so, our team did a deep dive on existing retinal, CT, and MRI imaging systems to understand current features and functionalities as well as how information is communicated to the end user.
Journey Mapping
Defining the current workflow across the entire care-continuum was imperative from both a patient and clinicians’ perspective. Through journey maps, we were able to identify key pain points, opportunity areas, gaps, while pinpointing roles & responsibilities.
Rapid Prototyping (HW & SW)
It was imperative that Verto hardware and software complement and harmonize with one another. Our team designed lo-fidelity prototypes of the HW that we could be used in conjunction with our SW prototypes during user testing to emulate a more realistic experience.
Design Sprints & Arguments
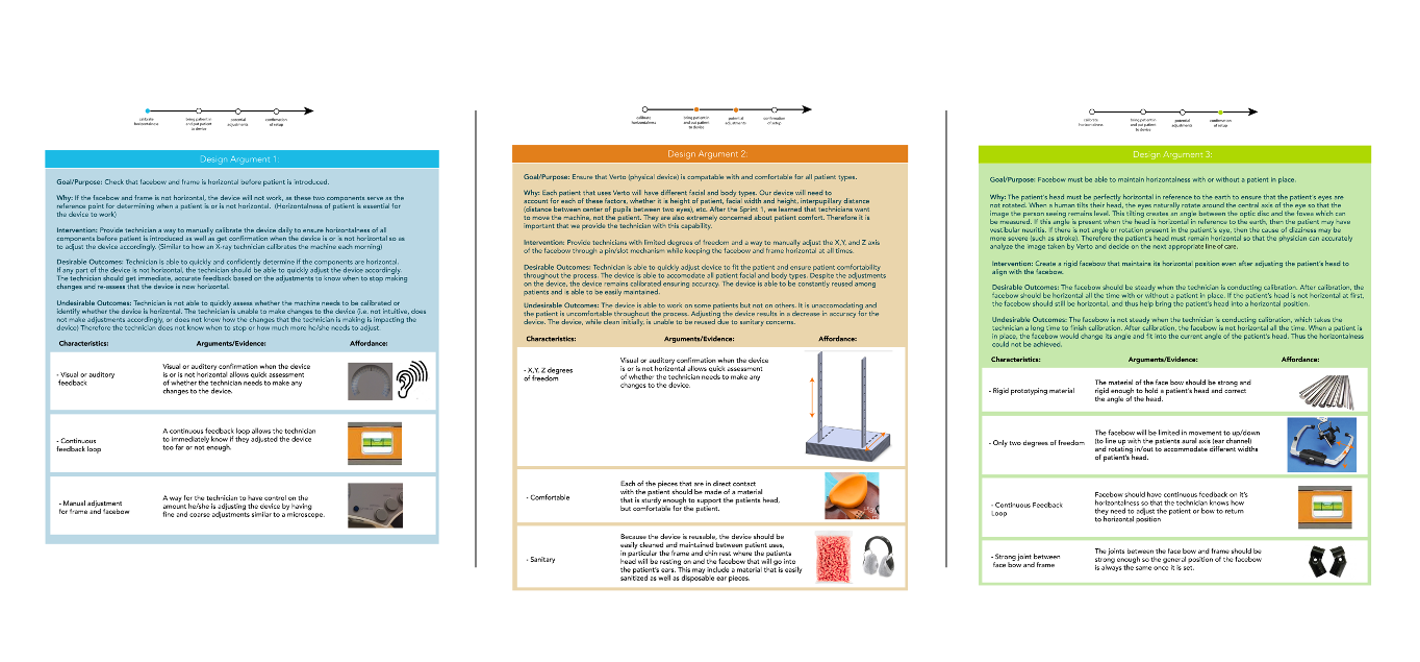
Our team worked in 2-week design sprints. Each week we crafted our design arguments documenting our assumptions, design characteristics, arguments/evidence from testing, and related questions. This systematic method enabled us to prioritize learning efforts in upcoming sprints.
Prototype, test, build & iterate
Leveraging lo-fidelity prototypes from paper prototypes and wireframes enabled the team to discover new insights and make informed design changes rapidly each sprint.
System Architecture Iterations & Key Learnings
Familiarity & Integration
It was imperative that our Interface for the technology can be integrated into an existing OCT camera and retinal imaging software. As a result, we focused on minimizing the learnability curve and maximizing efficiency by matching the content and flow of existing systems.
We leveraged familiar features, icons, interaction patterns from current technology and deviated where necessary to incorporate the unique features such as processing of images to identify anatomical features, calculations, presentation of results for informed decision making.
Manual vs Automatic
To increase accuracy, improve efficiency and reduce the amount of training/expertise required to use tech, it was critical that our technology leveraged a certain level of automation. However, we learned that technicians want to have some control/say in the analysis and don’t want to leave the full diagnosis to the machine.
As a result, our team prioritized features such as the automatic placement of dashed circle markers to narrow the area in which to analyze with the ability to be adjusted manually.
Enable Quick & Informed Decision Making
Because there are only qualitative diagnosis method currently, providing objective information to allow neurologists to make an informed decision quickly was key.
Through research and testing, we learned that having visually annotated image of angles / horizontal lines along with numerical numbers that compare OD & OS and interocular discrepancy were critical.
Training Video
Our team created a video as a training tool for HCPs that walked through the entire digital interface from user login in to image analysis and creating the results page.


